Demonstrating how we can measure glacier response to climate change using satellite imagery – Dr Varyl Thorndycraft
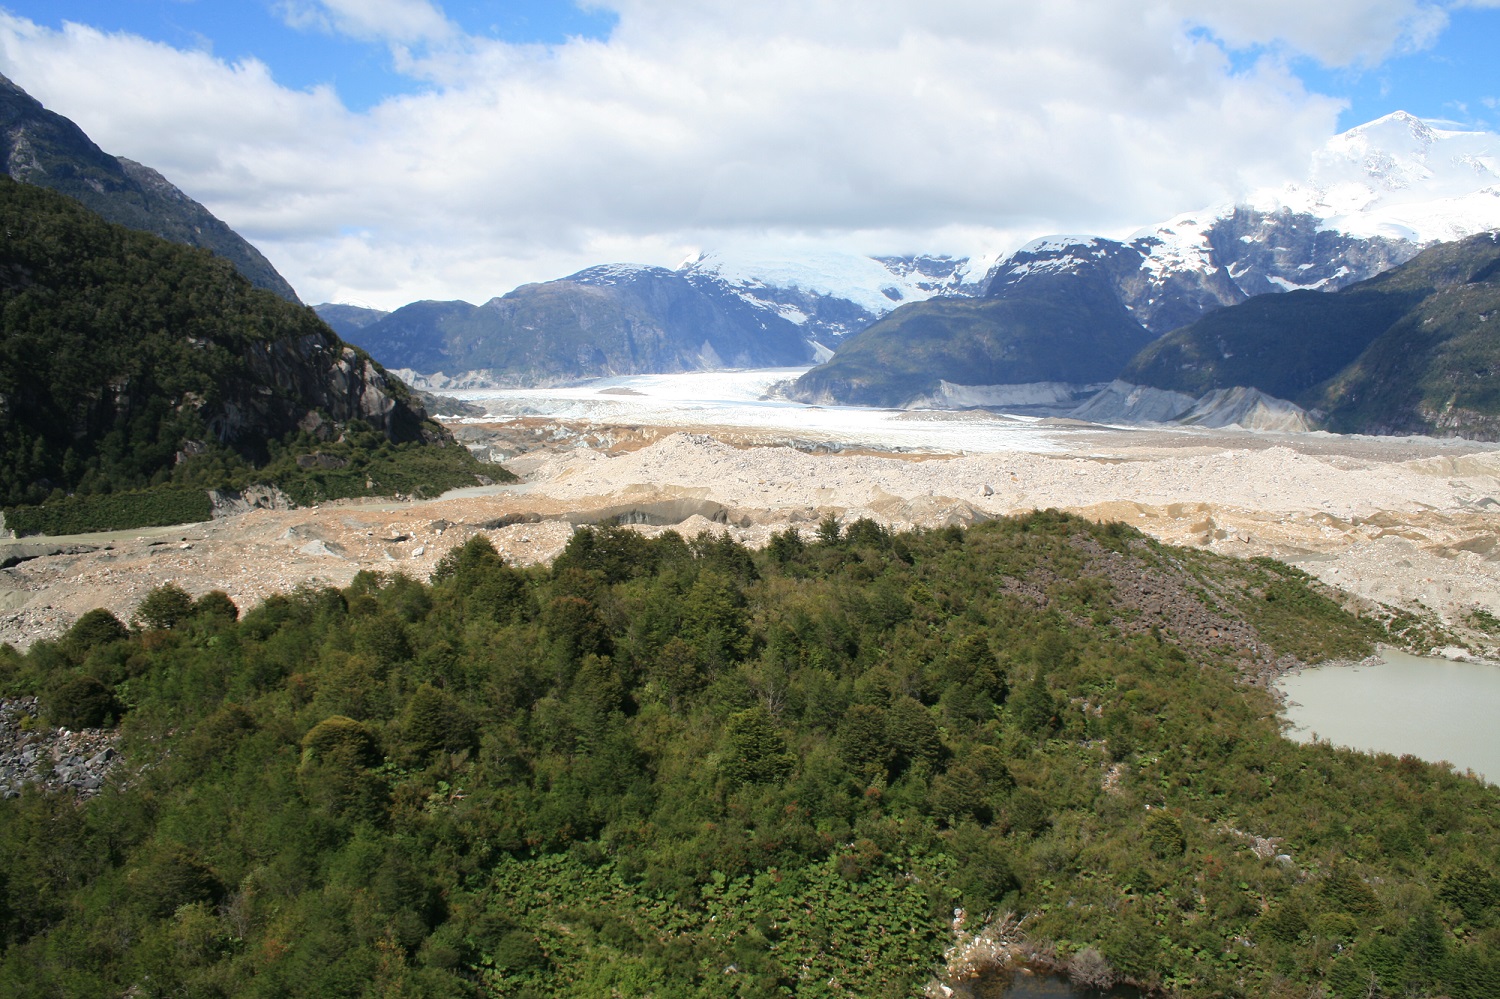
In this talk we shall look at how glacial landforms (e.g. moraines) and modern satellite imagery can be used to quantify rates of glacier recession driven by climate warming. We shall see how Patagonian glaciers were largely stable in their extent during the Holocene until the late 19th Century, with accelerated retreat occurring in the 21st Century. The activity will focus on using GIS and Google Earth to quantify recession of the Viedma glacier (Argentina), one of the largest valley glaciers sourced from the Southern Patagonia Icefield (the largest ice mass in the Southern Hemisphere beyond the Antarctic Ice Sheet).
Quantifying glacier change summary Quantifying glacier change activity
Please email to RHULGeogTeacherHub@rhul.ac.uk for the activity files.
This corresponds to the following components of the A-Level Syllabus:
Pearson Edexcel: 2A.8 a and c; Geographical skills (9) Numerical analysis of mean rates of glacier recession in different global regions
AQA: 3.1.4.5 Recent and prospective impact of climate change, and 3.1.4.6 (measurement and geospatial mapping)
OCR 2.b Case study of one landscape associated with the action of valley glaciers – case study from beyond the UK.


